
In the intricate dance of global markets, gold and cryptocurrencies have emerged as unique assets attracting investors looking for wealth preservation and speculative opportunities, respectively. While gold has historically been a bastion of stability, cryptocurrencies have rapidly become synonymous with volatility and cutting-edge investment. Both, however, can be analyzed through the lens of technical analysis, a tool that traders use to predict future market behavior based on past price movements and trends.
Unveiling the Charts: Gold & Crypto

The first step in technical analysis is understanding the chart in front of you. For both gold and cryptocurrencies like Bitcoin or Ethereum, price charts are the canvases where the market’s story unfolds. These charts can be viewed in various time frames, from minutes to days to years, depending on the trader’s strategy. Whether it’s a simple line graph or a complex candlestick chart, each offers insights into market sentiment and potential price direction. For gold, long-term charts are often scrutinized to gauge historical performance against current market conditions. In contrast, crypto traders might favor shorter timeframes to capitalize on swift price movements.
Decoding Patterns: Key Indicators
Patterns and indicators are the hieroglyphs of the financial markets, offering predictions that, when interpreted correctly, can lead to profitable trades. Key patterns that analysts look for in both gold and crypto markets include:
- Head and Shoulders: Indicative of a trend reversal.
- Double Top and Bottom: Signaling potential bullish or bearish future movements.
- Flags and Pennants: Short-term continuance patterns that indicate brief consolidations.
However, it’s imperative to note that while patterns can suggest possible outcomes, they are not guarantees. Market conditions, geopolitical events, and economic data releases can all influence the validity of pattern predictions.
Volume Analysis in Precious Metals

Volume plays a critical role in confirming the strength of a trend for precious metals like gold. An uptrend accompanied by increasing volume can indicate strong buyer interest, suggesting the trend may continue. Conversely, if the price of gold rises but volume is declining, it may signal a lack of conviction, warning of a potential reversal. Volume analysis can often provide clues about the sustainability of a move before the price action fully unfolds. In contrast to crypto markets, where volume can be dispersed across multiple exchanges, gold trading volume is more centralized, providing a clearer picture of market consensus.
Trend Lines: Crypto’s Market Pulse
Trend lines are a staple in any technical analyst’s toolkit, especially in the cryptocurrency markets. They are drawn to connect highs or lows to represent support and resistance levels. For cryptocurrencies, these trend lines can act as:
- Support Levels: Where the price finds a floor, typically sparking buying interest.
- Resistance Levels: Where the price might struggle to rise further, often triggering selling pressure.
Understanding these can give traders an edge, as breaking through these lines can lead to significant price swings, a common occurrence in the volatile crypto arena.
Understanding Oscillators & RSI
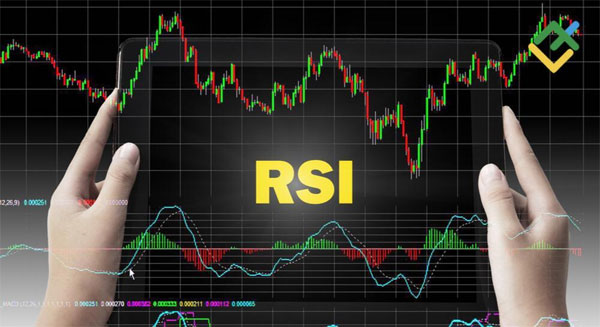
Oscillators and the Relative Strength Index (RSI) are tools used by traders to determine overbought or oversold conditions. The RSI, in particular, is a momentum oscillator that measures the speed and change of price movements on a scale of zero to 100. A reading above 70 is typically considered overbought, while below 30 is considered oversold. Oscillators can be particularly useful in the crypto market, which is known for its swift and dramatic price changes, but they are also pertinent when analyzing the gold market, where overextended trends might indicate a pending correction.
Forecasting: Gold and Crypto Futures

Looking ahead, forecasting the price movements of gold and crypto involves a mix of technical analysis, market sentiment, and broader economic indicators. With gold, investors might weigh the effects of inflation, currency devaluation, and economic uncertainty. In contrast, cryptocurrency forecasts can be swayed by technology updates, regulatory changes, and market adoption rates. Both markets are subject to speculative forces and can experience sudden shifts based on investor behavior and external shocks.
Comparison Table: Key Technical Analysis Factors for Gold and Crypto
| Factor | Gold Market Analysis | Crypto Market Analysis |
|---|---|---|
| Chart Time Frames | Longer-term preferred for stability | Shorter-term to capture volatility |
| Volume Interpretation | Centralized volume for clearer signals | Dispersed volume; exchange-specific |
| Trend Line Utility | Steady trends; less frequent breakouts | Swift trends; frequent breakouts |
| RSI Considerations | Used for spotting overextended trends | Critical for rapid price changes |
| Pattern Reliability | More consistent with economic factors | Prone to rapid shifts in sentiment |
| Market Influences | Economic data, monetary policy | Tech updates, regulation, adoption |
In the complex and ever-evolving worlds of gold and cryptocurrency trading, technical analysis remains a powerful tool for reading market conditions and forecasting future price movements. While the fundamental drivers of each market differ greatly, the technical disciplines of charting, pattern recognition, volume analysis, trend lines, and oscillators serve as a universal language for traders. By developing a deep understanding of these techniques and respecting the inherent differences between the gold and crypto markets, investors can navigate their chosen market with greater confidence and, potentially, success.